

At 2:13 a.m., monitoring detects a sharp increase in checkout failures. Detection is only the beginning. Something still has to decide which team owns the service, who is covering it tonight, how to reach that person, what context to send, and when to escalate if nobody responds.
That is the job of on-call software.
As a solutions engineer, I spend a lot of time looking at the path between an alert and the engineer expected to act on it. The schedule is the most visible part, but it is rarely where the hardest problems are. The real test is whether the system can turn an operational signal into accountable human action, including when ownership is stale, a notification channel fails, or fifty related alerts arrive at once.
This guide explains how on-call software works, which capabilities matter, how it differs from adjacent reliability tools, and what engineering teams should test before choosing a platform.
What is on-call software?
On-call software manages the engineering teams responsible for responding to operational alerts outside and inside normal working hours. It maintains schedules and rotations, resolves the current responder, delivers notifications, records acknowledgments, and executes escalation policies when the first person does not respond.
SRE, platform, infrastructure, DevOps, security, and product engineering teams use it to answer five practical questions:
- Who owns this service or failure mode?
- Who is responsible for it right now?
- How should that person be reached?
- What do they need in order to act?
- What happens if they cannot respond?
The software owns the consistent execution of those policies. The engineering organization still owns the policies themselves: service ownership, coverage expectations, alert quality, escalation authority, and the conditions under which a page should become a coordinated incident.
That distinction matters. A platform can deliver an alert exactly as configured while the wider on-call system still fails. If the service points to the wrong team or the notification contains no useful context, faster delivery only gets confusion to the responder sooner.
How does on-call software work?
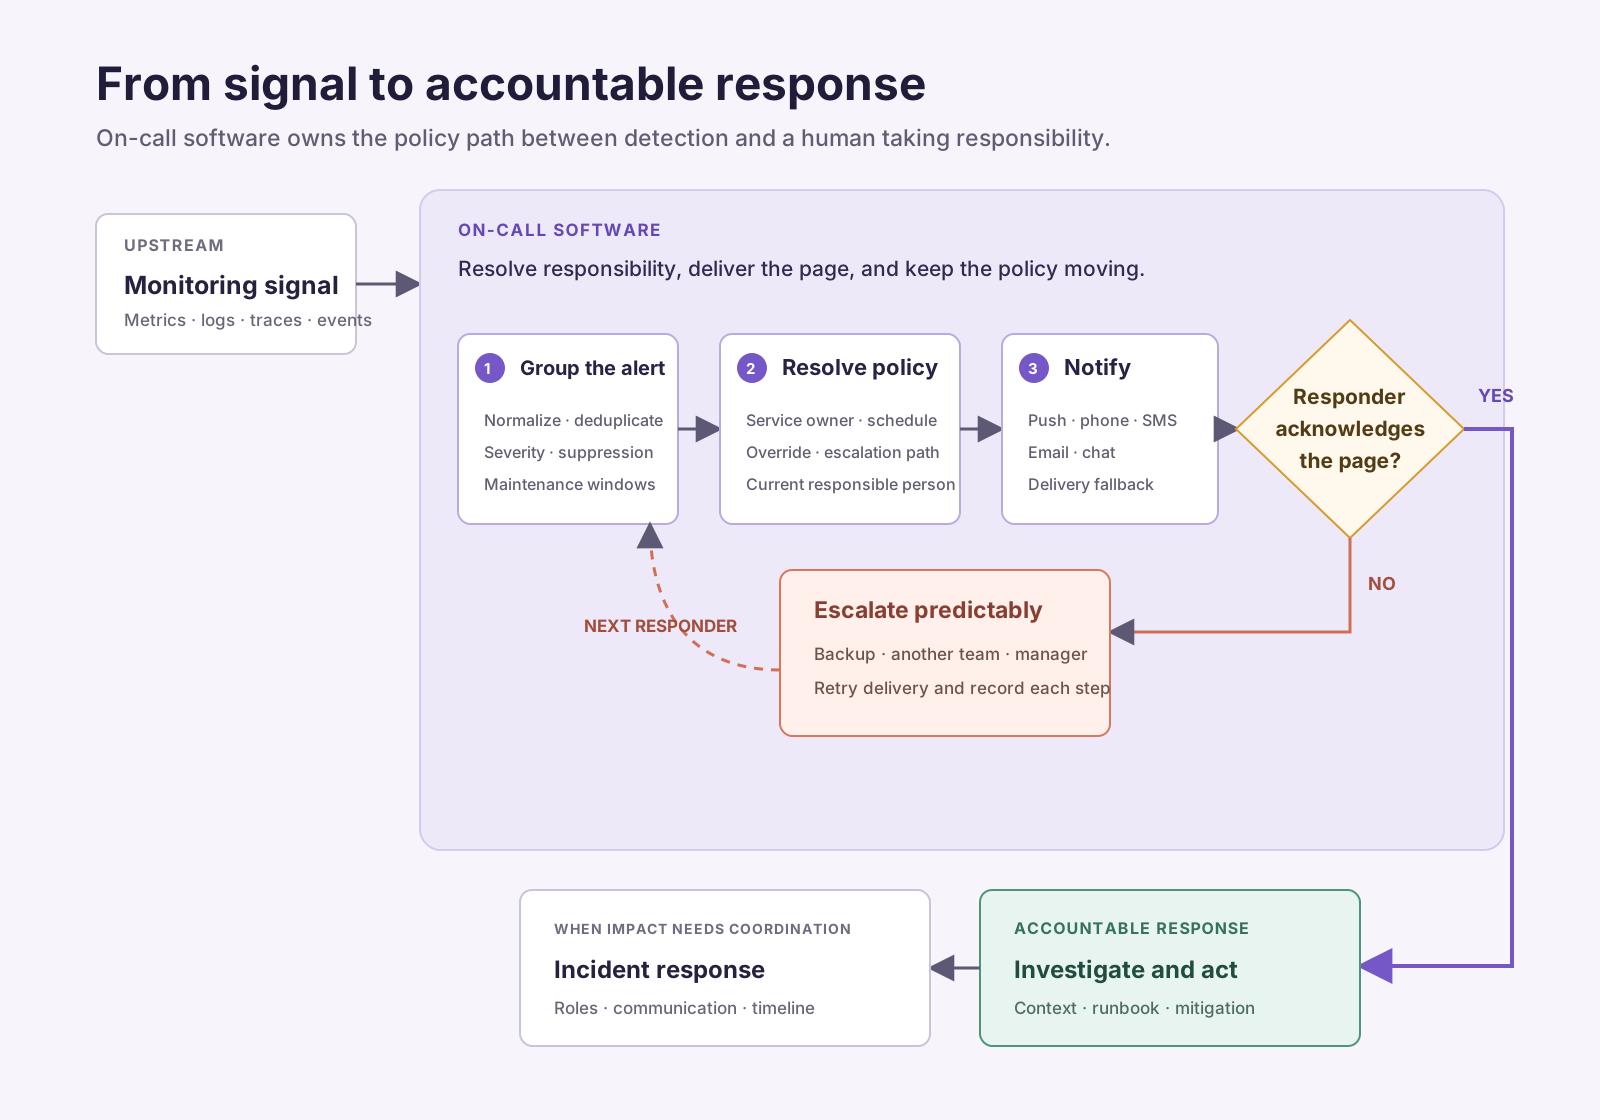
The basic path begins upstream in monitoring and observability:
- A signal crosses a condition. A monitoring system detects an error-rate increase, failed health check, security event, exhausted resource, or another condition that may require action.
- The alert is normalized and grouped. Alert-management rules deduplicate related events, suppress known noise, attach severity, and determine whether an interruption is warranted.
- Ownership and policy are resolved. The platform maps the alert to a service, team, environment, or routing rule, then finds the active schedule and escalation policy.
- The responder is notified. The system attempts push, phone, SMS, email, chat, or another configured channel and records delivery.
- The responder acknowledges or the policy escalates. An acknowledgment stops the current escalation path. No response moves the alert to a backup, another team, or a management escalation according to explicit rules.
- The responder investigates or declares an incident. The page should carry enough context to begin triage. If the impact requires broader coordination, the workflow moves into incident response.
The middle of this path is where on-call software does its most important work. It resolves responsibility at a specific moment and keeps executing the policy until someone accountable responds.
Core capabilities of on-call management software
Schedules, rotations, and overrides
On-call scheduling establishes who is responsible during a particular window. A useful platform should support primary and secondary rotations, schedule layers, time zones, holidays, temporary overrides, shift swaps, and follow-the-sun coverage without making the resulting schedule impossible to inspect.
Look beyond whether a calendar can be created. Engineers need to know who is actually on call after overrides are applied, whether any gaps exist, and how a change affects downstream escalation. The person shown in the final schedule—not the base rotation—is the person the platform must page.
Alert routing
Routing connects an alert to the correct service, team, schedule, and policy. Rules may use the alert source, service, environment, severity, region, or metadata supplied by a service catalog.
Good routing reduces the number of humans an alert has to pass through before it reaches someone able to act. Ganesh Datta, co-founder and CTO at Cortex, describes the familiar 2:00 a.m. problem: an engineer gets paged but cannot tell who owns the affected service or what it does. On-call software should consume reliable ownership data, not become another place where teams maintain a conflicting copy.
Notification delivery and acknowledgment
A notification has to arrive through channels responders will notice under real conditions. Push is convenient, but it should not be the only delivery path for urgent pages. Phone and SMS fallbacks, delivery status, channel-specific retries, and acknowledgment controls all matter.
Reliable delivery also means distinguishing between “sent,” “delivered,” and “acknowledged.” Those are different operational states. If a push provider accepts a message but the responder never sees it, the escalation policy still needs to move.
Escalation policies
Escalation policies define what happens when the first responder cannot acknowledge or needs additional expertise. They can move from a primary to a backup, engage another service team, or bring in an incident commander.
The best policies are explicit enough to remove guesswork and simple enough to reason about while tired. Deep trees of conditional rules may look flexible in a configuration screen but become difficult to test and maintain. The platform should make the active path and its timing visible.
Alert grouping and noise reduction
An on-call platform should help prevent one failure from producing dozens of independent interruptions. Deduplication, grouping, suppression, maintenance windows, rate limits, and routing rules can reduce unnecessary pages without hiding distinct impact.
Noise control is not the same as muting alerts. It should preserve the information needed to understand scope while reducing repeated interruptions. The dedicated alert fatigue guide covers the operational work behind that distinction.
Operational context
The notification is the responder’s starting point. It should identify the affected service and environment, summarize the triggering condition, show severity and customer impact when known, and link to the relevant dashboards, logs, traces, deploys, runbooks, owners, and recent incidents.
Gandhi Mathi Nathan Kumar, Principal Incident Commander at Twilio, measures responder friction in clicks and minutes. Every avoidable lookup delays orientation. An on-call platform does not need to reproduce the observability stack, but it should bring the first useful evidence into the page.
Integrations and workflow handoff
On-call software sits between systems. It needs dependable integrations with monitoring and observability tools, service catalogs, chat, ticketing, incident management, and status pages. APIs, webhooks, and infrastructure-as-code support matter when teams need routing and escalation configuration to follow the same review process as other production changes.
The handoff into incident response should also be clear. An acknowledgment says someone has taken responsibility for the alert. It does not necessarily mean the impact is understood, mitigated, or communicated.
Reporting and auditability
The platform should record alert receipt, routing decisions, delivery attempts, acknowledgments, overrides, escalations, and configuration changes. That history helps a team reconstruct what happened and distinguish a slow response from a failed policy.
Useful on-call metrics include actionable pages per shift, off-hours pages, escalation frequency, alert volume by service, repeated pages for the same condition, uncovered time, overrides, and the concentration of load across responders. Averages alone can hide the person or service absorbing most of the burden.
Security and administration
On-call data contains phone numbers, schedules, incident details, and sometimes sensitive operational context. Evaluate role-based access, SSO, audit logs, data retention, regional requirements, and how integrations are authorized.
Configuration changes deserve particular care. A modified routing rule or deleted schedule can prevent the right person from being reached. Teams should be able to review who changed a policy, when it changed, and what the previous state was.
What should engineering teams look for in on-call management software?
Look for reliable delivery, flexible scheduling, deterministic escalation, actionable alert context, strong integrations, effective noise controls, and enough auditability to understand both response performance and responder load.
That is the short answer. During an evaluation, I would turn each capability into a failure the platform has to handle:
| Evaluate | Questions to ask |
|---|---|
| Delivery reliability | What happens when push delivery fails? Are phone and SMS independent fallbacks? Can the team see each delivery state? |
| Scheduling | Can responders swap shifts or add an override without breaking escalation, reporting, or follow-the-sun coverage? |
| Escalation | Can policies represent primary, backup, cross-team, and management escalation without becoming opaque? |
| Alert quality | Can related alerts be grouped without suppressing distinct failures or customer impact? |
| Operational context | Can a responder identify the affected service, impact, owner, and first investigation links from the page? |
| Integrations | Does the platform work with the team’s actual monitoring, observability, service catalog, chat, and ticketing systems? |
| Configuration management | Can schedules, routing, and policies be reviewed, audited, exported, or managed as code? |
| Analytics | Can the team find noisy services, ineffective escalations, coverage gaps, and responders carrying disproportionate load? |
| Security | Are access, sensitive contact data, audit history, and integration credentials governed appropriately? |
| Platform resilience | How does paging behave during a provider, regional, push, telephony, or chat outage? |
| Migration | Can users, schedules, policies, integrations, and historical requirements be validated before cutover? |
Feature availability is only the first question. The implementation and failure behavior determine whether a capability is safe to depend on.
Test the failure path, not just the happy path
Most on-call demos follow an ideal sequence: an alert arrives, the correct person receives it, and they acknowledge immediately. Production is more creative.
Before choosing a platform, run a small operational exercise:
- Silence or disconnect the primary responder’s phone and observe the fallback.
- Add a last-minute override and confirm every relevant policy uses it.
- Send a burst of related alerts and inspect grouping, rate limits, and context.
- Route an alert with missing or stale service ownership.
- Disable one notification channel.
- Escalate from one service team to a dependency owner.
- Test a handoff between time zones.
- Deny an integration permission and inspect the failure.
- Reconstruct the full response from the audit history.
These tests show whether the system fails visibly and predictably. They also reveal how much operational work hides behind a polished interface.
If the team is migrating from another platform, test both systems against the same fixtures. Rootly co-founder Andre Yang’s on-call migration guide explains why schedules alone are the easy part; users, policies, integrations, alert flow, and edge cases all have to move together.
On-call software versus adjacent reliability tools
The categories overlap because many platforms combine them. It is still useful to separate the responsibilities:
| System | Primary responsibility |
|---|---|
| Monitoring and observability | Detect system behavior and support investigation |
| Alert management | Turn signals into actionable alerts and reduce noise |
| On-call software | Determine who responds and execute notification and escalation policies |
| Incident management | Coordinate investigation, mitigation, communication, and learning after an incident is declared |
| Service catalog | Record ownership, dependencies, and operational metadata |
| Status page | Communicate service impact to internal or external audiences |
An on-call platform may provide alert grouping, incident workflows, or service ownership features. That does not erase the boundaries. During procurement, map each required workflow to the system that will be authoritative for it. Otherwise, teams end up with different owners, severities, and service names in every tool.
Match the software to the engineering team
There is no universally correct on-call configuration. The system should fit the organization’s scale, architecture, risk, and staffing model.
- Small engineering teams may prioritize simple schedules, quick setup, dependable delivery, and policies that do not require a full-time administrator.
- Microservices organizations need strong service ownership, metadata-based routing, dependency context, and configuration automation.
- Distributed teams need reliable time-zone handling, follow-the-sun rotations, explicit handoffs, and visibility into local holidays and overrides. The global on-call guide explores those tradeoffs.
- Regulated organizations may place more weight on permissions, audit history, data location, retention, and separation of duties.
- High-volume teams need serious grouping, deduplication, suppression, and analytics so scale does not translate directly into interruptions.
The expected human load matters as much as the architecture. On-call compensation, recovery time, rotation size, and backup coverage shape whether the program remains sustainable. Adriana Villela, Principal DevRel at Dynatrace, connects on-call stress with responder effectiveness. A scheduling feature can distribute shifts; it cannot decide whether the burden is fair.
Implementing or migrating on-call software
Treat the rollout as an operational change, not a calendar import.
- Inventory services and owners. Resolve gaps before they become routing rules.
- Audit alerts. Decide which conditions require immediate human action and remove stale integrations.
- Define coverage. Document primary, backup, cross-team, and management escalation.
- Build schedules. Include overrides, holidays, time zones, and expected recovery.
- Attach context. Connect runbooks, dashboards, deploy information, ownership, and incident workflows.
- Configure delivery. Verify channels, fallbacks, acknowledgment behavior, and contact data.
- Test failure paths. Exercise the scenarios above with representative teams.
- Pilot before expanding. Start with a bounded service group and incorporate responder feedback.
- Plan cutover and rollback. Avoid an ambiguous period in which both systems appear authoritative.
- Review the first rotations. Inspect alert quality, missed pages, escalations, overrides, and human load.
The culture and training guide covers shadowing, readiness, and debriefs for responders joining a rotation. The automation guide addresses bounded automation after the basic response path is dependable.
What on-call software cannot fix
On-call software makes an operating model executable and visible. It cannot compensate for:
- Alerts that do not require immediate action
- Services without a current owner
- Rotations too small to provide recovery time
- Backups who are unprepared or unavailable
- Responders without permission or authority to mitigate
- Runbooks that are missing, stale, or untested
- A culture that treats every page as an individual failure
Those conditions often surface as tool complaints because the page is where engineers experience them. Replacing the platform without changing the underlying condition moves the same failure into a new interface.
A dependable system makes these problems easier to see. It shows coverage gaps, noisy services, repeated escalations, stale policies, and uneven responder load. The engineering organization still has to act on that evidence.
The standard I use
The right on-call software reliably carries an actionable signal to an accountable responder. It makes the current owner clear, brings enough context to begin, escalates predictably, and leaves an audit trail when something goes wrong.
I would not choose a platform solely because it can page someone quickly. I would choose it based on whether the team can understand and trust the entire path—from the first signal to the person taking responsibility—especially when the happy path breaks.
On-call software: what engineering teams should look for
On this page
Frequently asked questions
What is on-call software?
On-call software manages the people and policies responsible for responding to operational alerts. It maintains schedules and rotations, works out who is responsible right now, delivers notifications, records acknowledgments, and escalates when the first responder does not answer.
How is on-call software different from monitoring?
Monitoring detects a condition and supports the investigation. On-call software decides who needs to know about that condition, reaches them through the configured channels, and runs the escalation policy if they cannot respond.
What features matter most in on-call software?
Reliable notification delivery with phone and SMS fallbacks, schedules that handle overrides and time zones, explicit escalation policies, alert grouping and noise controls, useful context in the page itself, integrations with monitoring, chat and ticketing tools, and an audit trail of every routing decision and configuration change.
How should engineering teams evaluate on-call software?
Run failure scenarios as well as the demo path. Silence the primary responder's phone, add a last-minute override, send a burst of related alerts, route an alert with stale ownership, disable a notification channel, then reconstruct the whole response from the audit history.
How do you migrate to new on-call software?
Inventory services and owners, audit which alerts need a human, define coverage and escalation, build schedules with overrides and holidays, attach runbooks and dashboards, verify delivery channels, test failure paths, pilot with one service group, and plan cutover and rollback so only one system is authoritative at a time.
What can on-call software not fix?
Alerts that need no immediate action, services without a current owner, rotations too small to allow recovery, unprepared backups, responders without authority to mitigate, and stale runbooks. Good on-call software makes these problems visible, and the engineering organization still has to act on them.