
Incident Response Tools: How to Choose the Right One
On this page
Incidents are an unavoidable part of running modern digital systems. Whether it is an outage, a security breach, or a performance slowdown, how your team responds in those first moments determines how quickly services return to normal. For engineering, SRE, DevOps, and platform teams, incident response tools have become essential. They keep workflows organized, streamline communication, and help resolve issues before they affect users or the business.
These platforms combine automation, collaboration, and real-time visibility to cut delays and guide decisions. They automatically route incidents to the right people, eliminate manual tasks, and provide a single source of truth for the entire team. With the right tool in place, incident response becomes a smooth, repeatable process rather than a chaotic scramble.
Understanding Incident Response Tools
What Incident Response Tools Are and Why They Matter
Incident response tools are software platforms that help teams detect, manage, and resolve disruptions in a structured and coordinated way. Instead of relying on scattered alerts, manual communication, or ad hoc processes, these platforms bring every part of the response into one central environment. They make it easier to act quickly, stay organized, and ensure that nothing is overlooked during high-pressure situations.
These tools are not standalone solutions. They are part of a larger incident management lifecycle that begins with detecting an issue and continues through resolution and post-incident learning. Their purpose is to support every stage of that process. They alert teams when something goes wrong, coordinate the right people and resources, facilitate clear communication, and capture lessons that prevent future incidents.
The core objectives of incident response software can be summarized as follows:
- Detection of potential problems as soon as they occur
- Coordination of teams and resources for a fast and focused response
- Communication across departments and stakeholders to keep everyone aligned
- Post-incident analysis to understand what happened and why
- Prevention of similar disruptions in the future by identifying weaknesses and improving processes
By transforming a reactive process into a structured workflow, these tools help organizations resolve incidents faster, reduce the impact on users, and continuously improve the reliability of their systems.
Key Features Every Incident Response Platform Should Include
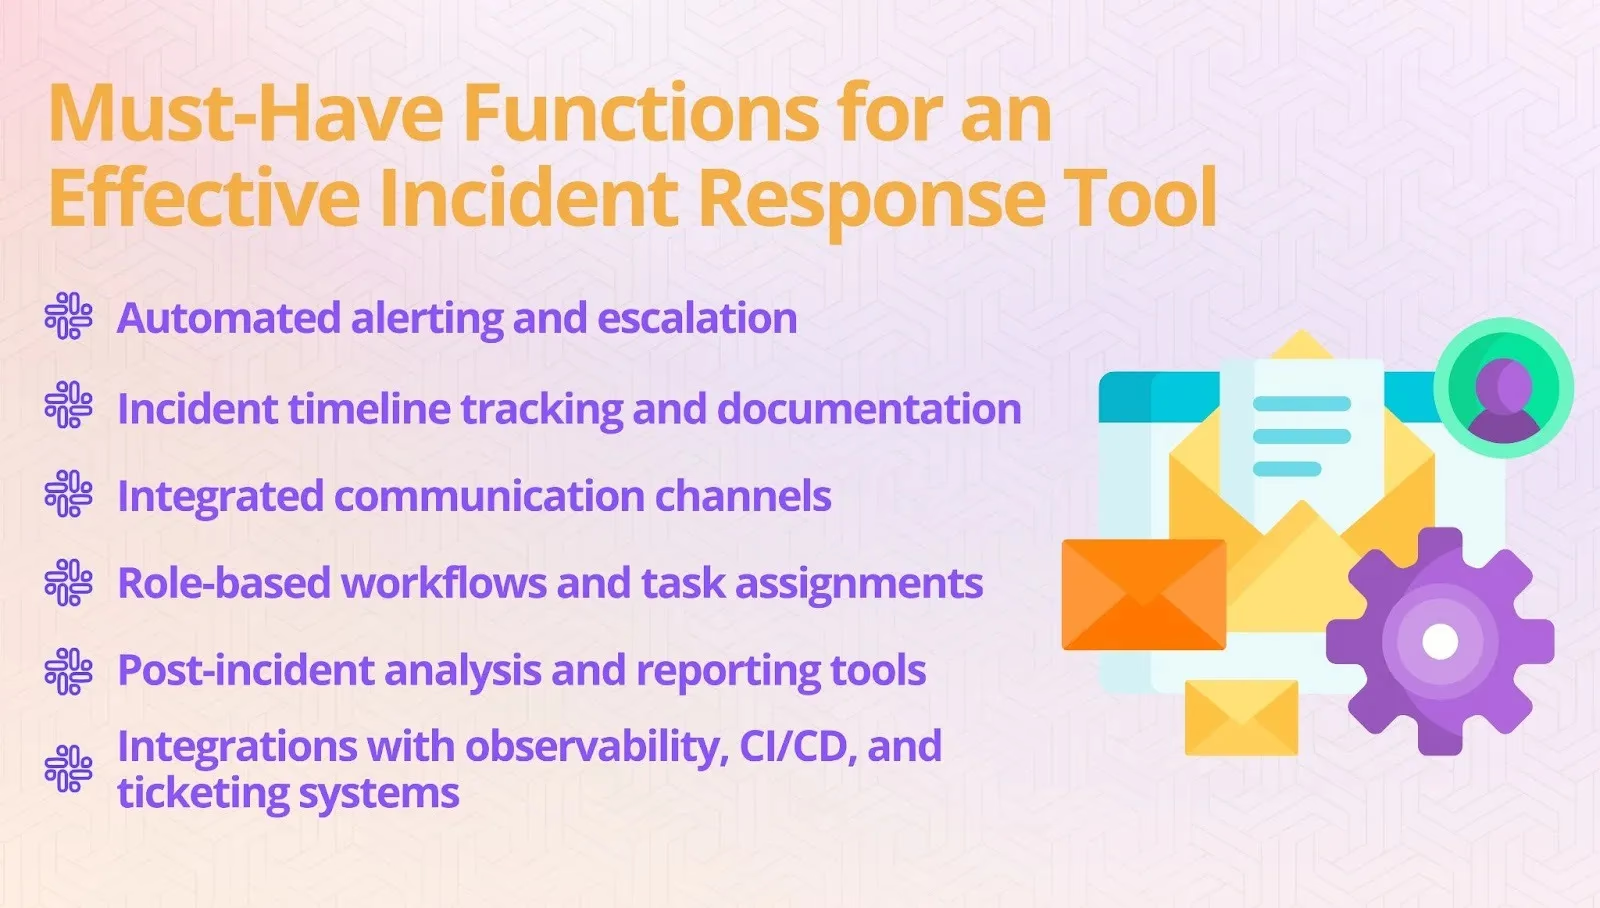
A strong incident response platform goes beyond basic alerting. It provides end-to-end support for every stage of the response lifecycle. When evaluating tools, make sure they include the following essential features:
- Automated alerting and escalation - The software should detect issues automatically and notify the right people without delay. Automated escalation ensures incidents are assigned to the appropriate responders based on severity, schedule, or expertise.
- Incident timeline tracking and documentation - Detailed documentation of every event, decision, and action is crucial. Built-in timeline tracking creates a complete record of the incident as it unfolds, which is valuable for reviews, audits, and future improvements.
- Integrated communication channels - Effective communication is critical during an incident. Platforms that integrate with messaging tools like Slack or Microsoft Teams allow teams to collaborate in real time and share context without switching between applications.
- Role-based workflows and task assignments - Clear roles and responsibilities ensure that everyone knows what to do. Automated task assignments help structure the response process and reduce the risk of missed steps.
- Post-incident analysis and reporting tools - The work does not end when the incident is resolved. Built-in analysis tools support root cause investigations, performance tracking, and process improvement, turning each incident into an opportunity to strengthen your systems.
- Integrations with observability, CI/CD, and ticketing systems - A platform that connects with monitoring, deployment, and project management tools provides richer context and faster resolution. Seamless integrations create a unified ecosystem that supports the entire response process from start to finish.
Together, these features create a complete framework for handling incidents. They help teams respond quickly, collaborate effectively, and continuously improve how they manage disruptions.
How Incident Response Tools Work in Practice
Incident response tools turn chaotic situations into clear, repeatable processes. They guide teams through every stage of an incident, from the first alert to the final review, helping reduce downtime and improve outcomes.
The Typical Incident Response Lifecycle Explained
- Detection and alerting - The tool identifies issues early and automatically alerts the right people so action can begin immediately.
- Triage and classification - Incidents are prioritized based on severity and impact, ensuring critical problems are handled first.
- Coordination and communication - All updates, discussions, and decisions are centralized, keeping teams aligned and eliminating confusion.
- Resolution and remediation - Guided workflows, tasks, and runbooks help teams fix issues quickly and restore normal operations.
- Review and postmortem - A complete incident record is automatically generated, making it easier to analyze causes and improve future responses.
How Tools Streamline Each Stage
- Automating alerts speeds up detection and reduces response time.
- Real-time collaboration helps teams make decisions faster and resolve incidents sooner.
- Predefined runbooks standardize responses, improving consistency and reducing errors.
- Timeline capture ensures every action and decision is documented for effective postmortem analysis.
With these capabilities, incident response tools help teams move quickly, communicate clearly, and continuously improve how they handle disruptions.
Choosing the Right Incident Response Software for Your Team
Finding the right platform is about more than just comparing features. The best tool is one that fits your workflows, supports your team’s goals, and grows with your organization. A thoughtful selection process ensures the software you choose adds real value rather than becoming another system to manage.
Step-by-Step Guide to Selecting a Platform
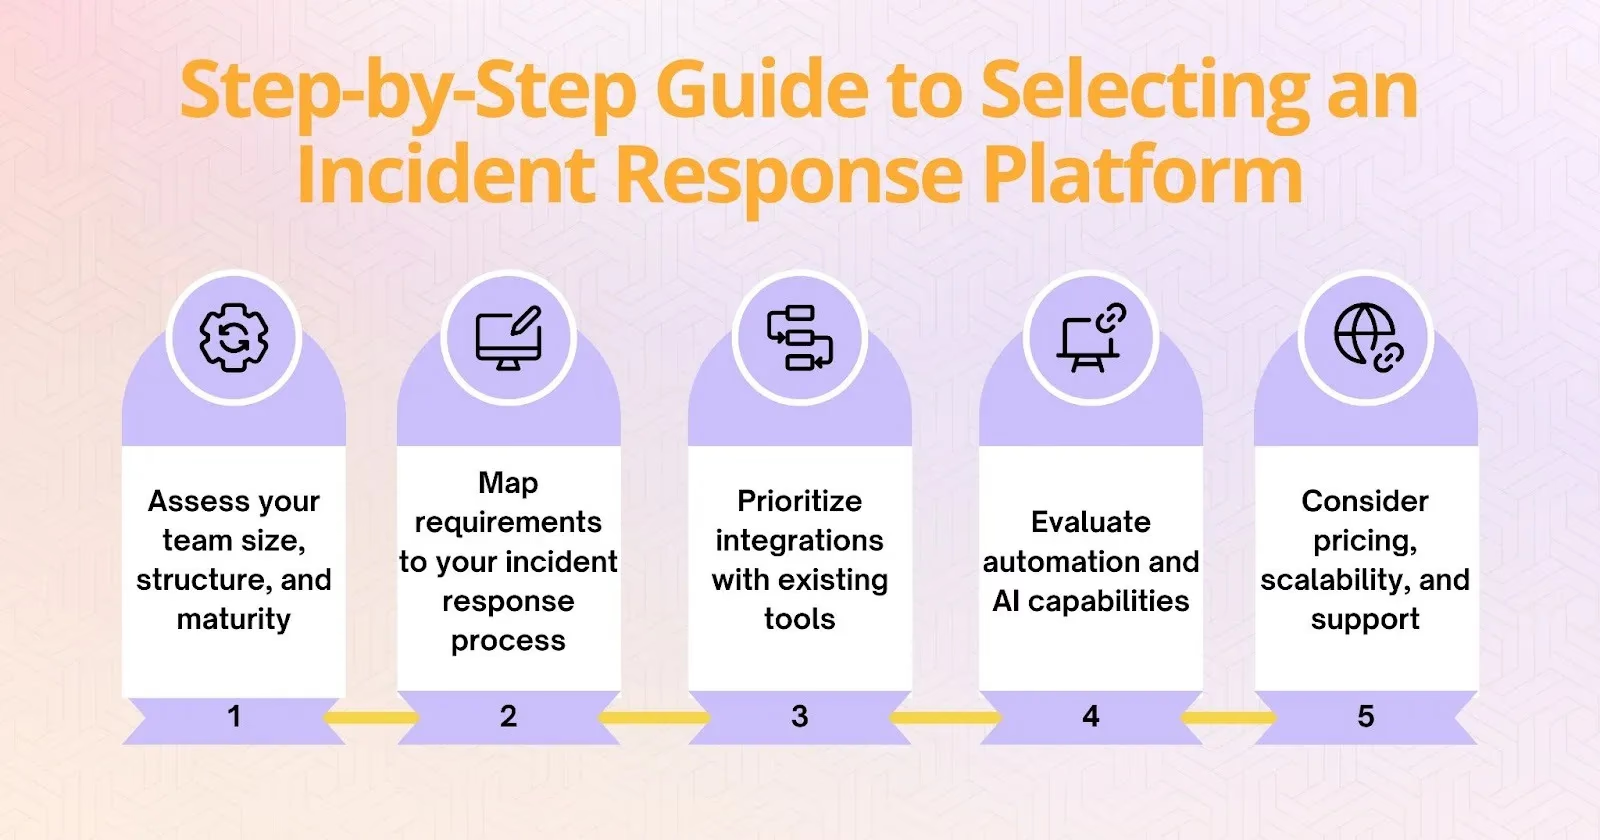
- Assess your team size, structure, and maturity - Start by understanding how your team operates. A small startup may need a simple, automated solution, while larger organizations often require more advanced features, detailed reporting, and compliance support.
- Map requirements to your incident response process - Identify the challenges you face and match them to the capabilities you need. If communication is a bottleneck, prioritize tools with strong collaboration features. If documentation is inconsistent, focus on platforms that offer automated tracking.
- Prioritize integrations with existing tools - The software should connect smoothly with monitoring, ticketing, CI/CD, and observability tools you already use. Seamless integration reduces friction and improves visibility during incidents.
- Evaluate automation and AI capabilities - Automation can significantly reduce response times and remove repetitive tasks. Advanced tools now use AI to suggest next steps, analyze incidents, or even predict potential issues before they occur.
- Consider pricing, scalability, and support - Look beyond initial cost. Choose a platform that can scale with your organization’s growth and offers responsive support, clear documentation, and ongoing updates.
Common Mistakes Teams Make When Choosing Tools
- Overvaluing alerting without workflow automation - Alerts are only the beginning. Without built-in workflows and automation, teams spend valuable time coordinating manually.
- Ignoring cross-team collaboration needs - Effective incident response requires coordination across engineering, operations, and leadership. Tools without strong collaboration features slow down communication.
- Choosing tools that do not support blameless postmortems - Post-incident analysis is essential for learning and prevention. Without built-in reporting and documentation features, important lessons can be lost.
- Overcomplicating with features you will never use - More features do not always mean a better tool. Complex platforms that exceed your team’s needs often lead to low adoption and wasted budget.
A carefully chosen platform becomes an integral part of your team’s workflow, improving speed, communication, and confidence every time an incident occurs.
Comparing Top Incident Response Tools in 2026
Overview of Leading Platforms
Modern incident response platforms go far beyond simple alerting. They focus on automation, collaboration, and continuous improvement. The best choice depends on your team size, workflows, and long-term needs.
- Rootly - A Slack-native platform that automates workflows, assigns tasks, and builds incident timelines automatically. Its AI features and strong integrations make it ideal for scaling response and improving post-incident learning.
- PagerDuty - A widely used tool with powerful alerting, escalation, and scheduling. Its analytics and predictive features suit large enterprises, though teams often weigh its cost and complexity (see Rootly vs PagerDuty).
- incident.io - A Slack-first incident management platform with strong workflow automation and status pages. It is a common modern alternative for teams evaluating options (see Rootly vs incident.io).
- Jira Service Management - Atlassian’s ITSM and incident tool, a natural fit for organizations already standardized on Jira, though it is less engineering-native than Slack-first platforms.
- Opsgenie - An Atlassian alerting and escalation tool. Note that Atlassian is sunsetting Opsgenie (end of life April 2027), so teams relying on it should plan a migration path (see Rootly vs Opsgenie).
- Squadcast - A simple yet capable platform for small and mid-sized teams. It offers automation, runbooks, and service tracking with an easy-to-use interface.
- Grafana IRM (OnCall) - Brings alerting and on-call scheduling directly into the Grafana observability stack, keeping detection and response close together for teams whose dashboards already live in Grafana.
- Splunk On-Call - Formerly VictorOps, it pairs alerting and on-call with Splunk’s observability and log analytics, a solid fit for SRE teams built on Splunk monitoring data.
- Datadog On-Call - Extends the Datadog platform into paging and escalation so teams consolidating observability on Datadog can manage on-call without adding another vendor.
- Better Stack - Bundles uptime monitoring, on-call, and status pages with a quick, modern setup, a pragmatic pick for smaller teams that want monitoring and response in one product.
- Zenduty - Combines alerting and on-call with response playbooks and SLA tracking, targeting mid-market teams that want more structure than basic paging.
- xMatters - Focuses on reliable notification, flexible workflows, and audit-ready incident records for large, regulated organizations where compliance and traceability are top priorities.
- BigPanda - Specializes in AIOps-style alert correlation, compressing large volumes of noisy alerts into actionable incidents before they ever reach a responder.
- ServiceNow - Handles incident, problem, and change management at enterprise scale, the right fit for organizations already running ServiceNow as their IT system of record.
Each platform offers a different balance of automation, collaboration, and scalability. If your priority is on-call scheduling and alerting or an AI-driven approach to SRE, weigh those needs alongside core response features. The right choice depends on your team’s size, infrastructure, and reliability goals.
Incident Response Tools Pricing Comparison (2026)
Pricing models vary widely across the category — per-user seats, per-responder tiers, platform fees, and usage-based add-ons for AI or status pages. Published pricing changes frequently, so treat this as a directional guide and confirm current numbers with each vendor for your team size and required tier.
| Platform | Pricing model | Free tier / trial | Typical fit |
|---|---|---|---|
| Rootly | Per-user, per product or full platform; custom enterprise | Trial | Startups through enterprise |
| incident.io | Per-user, tiered | Trial | Teams wanting one prescribed process |
| PagerDuty | Per-user, tiered (add-ons) | Free (small) + trial | Large alerting operations |
| Jira Service Management | Per-agent, tiered | Free (small) + trial | Atlassian/ITSM shops |
| Opsgenie | Per-user (EOL Apr 2027) | Legacy | Migrate off before EOL |
| Squadcast | Per-user, budget tiers | Free + trial | Cost-conscious SRE teams |
| Better Stack | Usage/seat tiers | Free + trial | Small teams, fast setup |
| Datadog On-Call | Per-user add-on to Datadog | Trial | Datadog customers |
Best for Startups and Small Teams
Early-stage teams should prioritize fast setup, low cost, and minimal process overhead. Better Stack, Squadcast, and Zenduty deliver alerting and on-call without heavy configuration. If you expect to scale quickly and want automation you won’t outgrow, a Slack-native platform like Rootly avoids a painful re-platforming later — the workflows that save a five-person team an hour a week save a fifty-person team far more.
Best PagerDuty Alternatives
Teams leave PagerDuty mainly over cost and complexity. The strongest alternatives pair reliable alerting with modern, chat-native workflows and automation — Rootly, incident.io, and Grafana IRM are the most common landing spots. A detailed feature and pricing breakdown lives in Rootly vs PagerDuty.
Best Opsgenie Alternatives (EOL Migration)
With Atlassian sunsetting Opsgenie in April 2027, its installed base needs a migration target that preserves schedules, escalation policies, and integrations. Evaluate options on migration tooling and Atlassian-adjacent workflows rather than feature checklists alone, and run old and new platforms in parallel during cutover. Start with Rootly vs Opsgenie for a step-by-step migration path.
Deep Dive: How Rootly Stands Out
Rootly’s Core Approach to Incident Response
- Slack-native design for frictionless collaboration
Rootly lives where your team already communicates. By operating directly within Slack, it eliminates the need to switch tools, making coordination faster and more natural during high-pressure moments.
- Automated workflows triggered by incident severity
The platform automatically initiates workflows based on how serious an incident is. Whether it is assigning roles, creating channels, or escalating alerts, Rootly removes manual steps so teams can act immediately.
- AI-powered task orchestration and status updates
Artificial intelligence suggests actions, prioritizes tasks, and even drafts summaries and stakeholder updates. This speeds up decision-making and reduces the cognitive load on responders.
- Built-in postmortem creation and knowledge base integration
Rootly automatically captures key events and decisions to generate a postmortem draft. It integrates with knowledge bases to turn incidents into learning opportunities and strengthen future responses.
Automating Incident Response with Slack: Why Integration Matters
One of the most effective ways to maximize the value of an incident response platform is by integrating it with the communication tools your team already relies on. Slack, for example, has become the central hub for engineering, SRE, and DevOps teams, and managing incidents directly within it can significantly reduce friction and speed up response times.
Why Slack is an Effective Incident Command Center
During a high-severity event, responders are already juggling complex systems, multiple dashboards, and rapid decisions. Adding another standalone interface often slows them down. By embedding incident response workflows into Slack, teams can coordinate, communicate, and act without switching contexts. This approach removes unnecessary overhead, improves focus, and ensures that everyone from engineers to stakeholders remains aligned in real time.
How Slack Automation Enhances Incident Response
Modern tools like Rootly extend Slack beyond a messaging platform, transforming it into a complete incident command environment. Automation enhances the response process in several key ways.
- Automated channel setup - Teams can instantly create a dedicated incident channel with preconfigured links, video conferencing options, and relevant runbooks the moment an alert is triggered.
- Targeted escalation notifications - Leadership, stakeholders, or specialized teams can be notified automatically based on the severity of the incident, reducing delays in decision-making.
- Integrated status updates - Updates can be published directly to customer-facing status pages or internal dashboards from Slack, ensuring consistent and timely communication throughout the incident.
- Streamlined postmortem kickoff - Incident data and milestones can be captured automatically, making retrospective reviews faster, more accurate, and easier to initiate.
- AI-driven response support - Built-in AI can summarize incidents, suggest next steps, or identify similar past cases, reducing manual effort and enabling faster, more informed decisions.
By centralizing detection, collaboration, escalation, and review within Slack, incident response platforms streamline the entire lifecycle from alert to resolution. This approach accelerates workflows, improves visibility across teams, and reduces cognitive load during high-pressure situations.
Rootly vs Traditional Platforms
- Workflow-first vs alert-first approaches
Traditional tools focus on sending alerts. Rootly prioritizes workflows and structured responses, helping teams act quickly instead of just reacting.
- Human-in-the-loop automation vs manual coordination
Rootly uses automation to reduce manual tasks while keeping humans in control of decisions, striking a balance between speed and judgment.
- Seamless integration vs tool sprawl
Rootly consolidates response, communication, and documentation into one environment, avoiding the scattered toolsets that slow teams down.
This focus on automation, context, and usability makes Rootly more than just another incident response platform. It becomes a complete system for managing, learning from, and preventing incidents — all while improving how teams work together.
Advanced Features to Look For in Modern Incident Response Tools
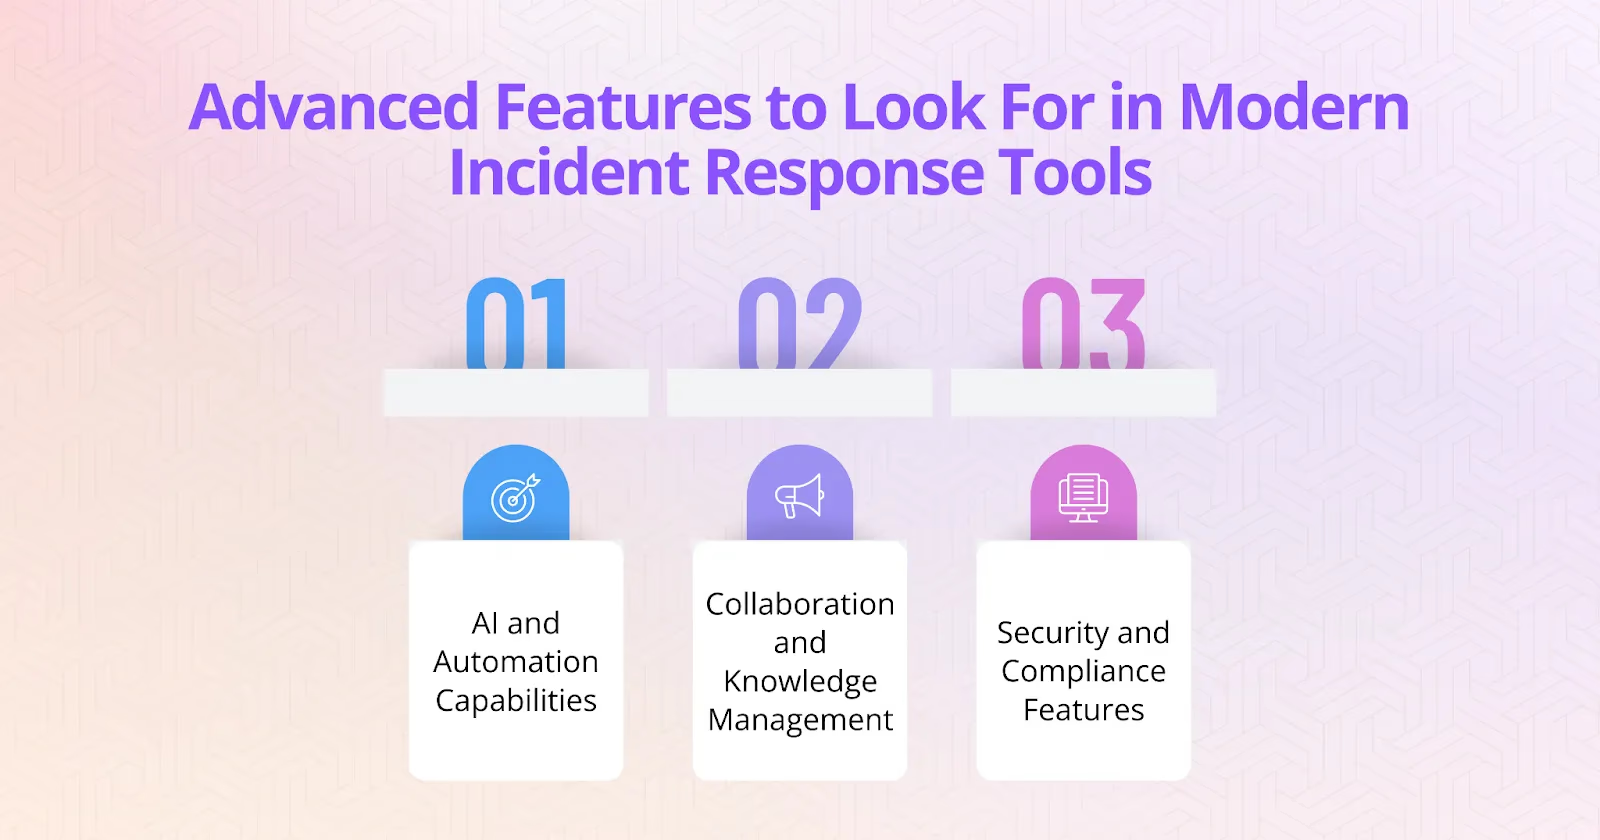
The most effective incident response platforms go beyond basic alerting and coordination. They use automation, intelligence, and collaboration features to improve decision-making, reduce errors, and create a continuous cycle of learning. When evaluating tools, these advanced capabilities can make a significant difference in how quickly and effectively your team responds.
AI and Automation Capabilities
- Predictive escalation and impact analysis
Artificial intelligence can analyze data from past incidents and current conditions to predict how an event might unfold. This helps teams prioritize responses and escalate issues before they grow into larger problems.
- Intelligent runbook suggestions
AI-powered platforms can recommend the most relevant response playbooks based on the type of incident, reducing decision fatigue and ensuring best practices are followed consistently.
- Automated stakeholder communication and status pages
Keeping stakeholders informed is critical during incidents. Automation can generate real-time updates, notify customers, and update status pages without requiring manual effort from responders.
Collaboration and Knowledge Management
- ChatOps and channel-based coordination
Modern platforms integrate directly with communication tools, enabling responders to collaborate and execute tasks from within chat channels. This approach reduces delays and keeps everyone aligned.
- Dynamic timeline creation and knowledge capture
Automated documentation of actions, messages, and decisions builds a complete timeline as the incident unfolds. This improves transparency and provides valuable context for post-incident analysis.
- Seamless post-incident learning loops
The best tools turn every incident into a learning opportunity. They make it easy to link outcomes to documentation, share lessons across teams, and update playbooks based on what was learned.
Security and Compliance Features
- Role-based access controls
Granular permissions ensure that only the right people can access sensitive information, reducing risk and supporting secure collaboration.
- Audit logs and evidence storage
Detailed records of every action and decision provide a clear audit trail. These logs are essential for understanding the incident and meeting legal or regulatory requirements.
- Compliance reporting
Built-in reporting features make it easier to demonstrate compliance with standards such as SOC 2 and ISO 27001, which is increasingly important for organizations operating in regulated industries.
Best Practices for Implementing Incident Response Tools
Even the most advanced incident response software will fall short if it is not implemented thoughtfully. Successful adoption is not just about installing a new tool but about integrating it into existing workflows, training teams to use it effectively, and refining how it supports operations. A strategic rollout ensures the platform delivers value from the start and continues to improve over time.
Steps to a Successful Rollout
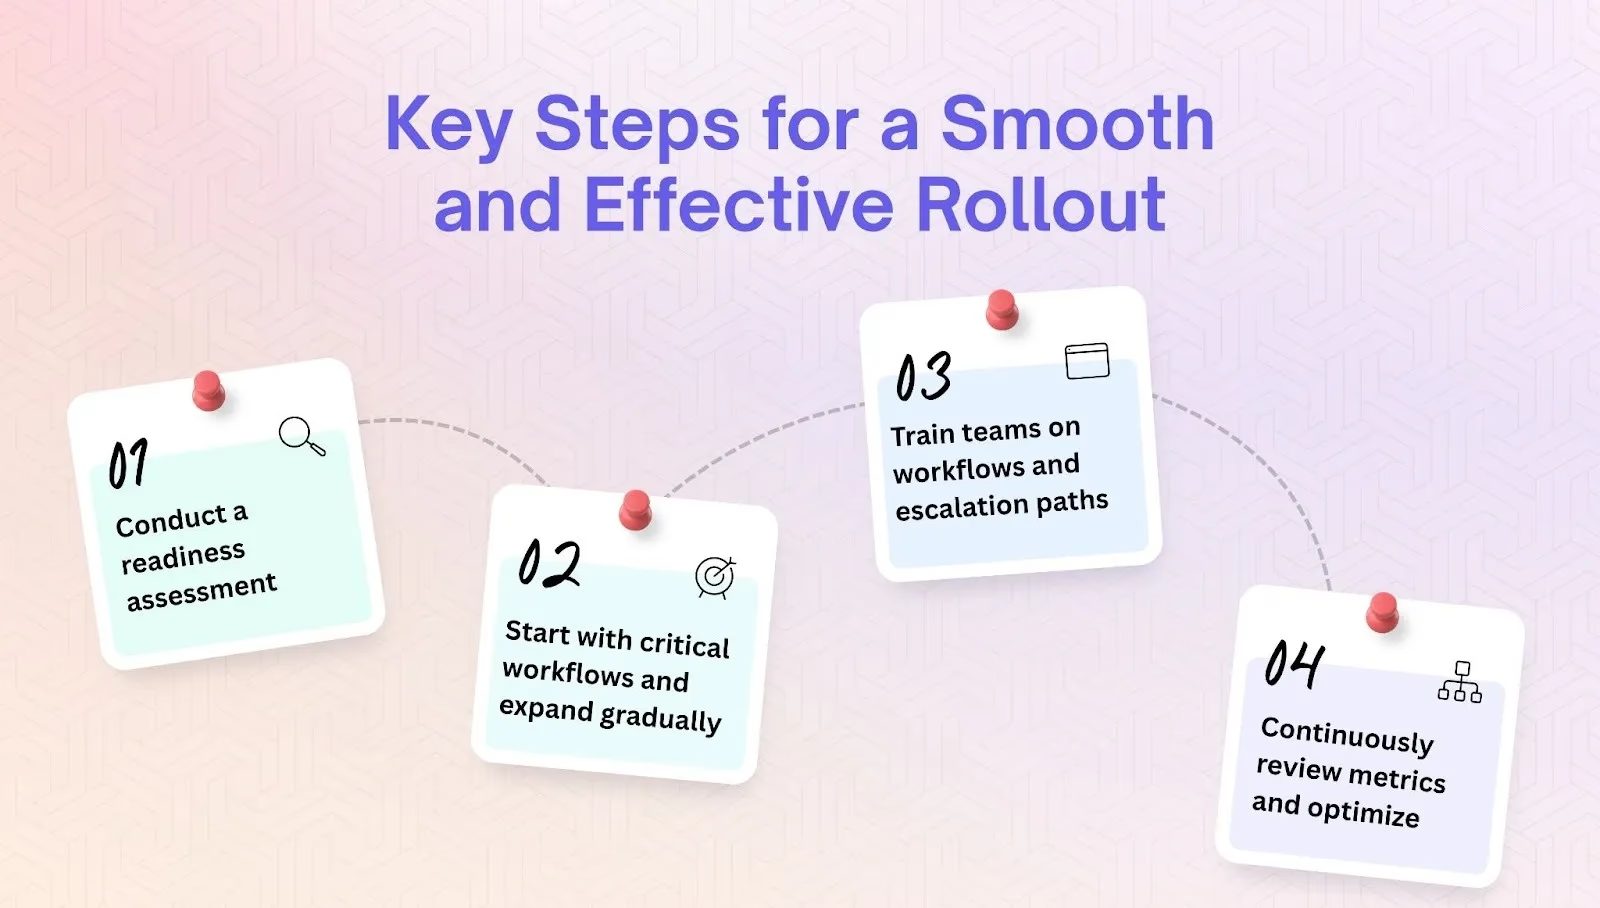
- Conduct a readiness assessment
Before implementation, review your current incident response process. Identify strengths, weaknesses, and gaps in detection, communication, documentation, and postmortem practices. Understanding where you are now helps define how the new tool can best support your future state and align with team goals.
- Start with critical workflows and expand gradually
Rolling out every feature at once can overwhelm teams. Begin with the most essential workflows, such as automated alerting or on-call escalation, and expand to more advanced capabilities like AI-driven recommendations or automated postmortems once users are confident. This phased approach builds trust and reduces resistance to change.
- Train teams on workflows and escalation paths
Even the most capable platform is ineffective without proper user adoption. Offer training sessions and clear documentation so responders understand how incidents progress, how escalation is handled, and where to find critical information. Reinforce best practices through simulations and scenario-based exercises that mirror real situations.
- Continuously review metrics and optimize
Implementation is an ongoing process. Regularly review performance metrics, gather feedback, and analyze usage data to identify opportunities for improvement. Refine workflows, update runbooks, and adjust integrations as your systems evolve and new challenges arise.
Metrics to Measure Tool Effectiveness
- MTTA (Mean Time to Acknowledge) - Shows how quickly incidents are detected and acknowledged. A shorter MTTA indicates faster awareness and a quicker response start.
- MTTR (Mean Time to Resolve) - Tracks how long it takes to fully resolve incidents. A lower MTTR suggests the tool is helping teams restore services more efficiently.
- Incident recurrence rate - Measures how often the same issues return. A declining recurrence rate indicates that postmortem insights are being applied to prevent future disruptions.
- Postmortem completion rate - Shows how consistently incident reviews are documented and shared. High completion rates reflect a strong learning culture and effective knowledge capture.
- Automation adoption rate - Reveals how much of the response process is being handled automatically. Higher adoption means improved efficiency and reduced manual workload.
By following a structured rollout and continuously measuring outcomes, your incident response platform becomes more than a tool — it becomes a core part of how your organization prevents, manages, and learns from disruptions.
Future Trends in Incident Response Tools
The next generation of incident response software is evolving beyond reaction to focus on prevention, intelligence, and team resilience. AI copilots will increasingly support incident command and triage by suggesting next steps and prioritizing actions in real time. Predictive analytics will enable proactive runbooks and early intervention before outages occur. Platforms will become more unified, bringing observability, response, and learning into a single ecosystem. At Rootly we are already moving in this direction by combining automation, AI, and collaboration into one seamless platform that helps teams anticipate incidents, act faster, and improve with every response. Finally, there will be a stronger emphasis on psychological safety and blameless culture, helping teams learn from incidents without fear and improving collaboration across the organization.
Frequently Asked Questions
What are incident response tools?
Incident response tools are software platforms that help engineering, SRE, and DevOps teams detect, coordinate, communicate, and resolve outages and other disruptions in one place. They automate alerting and escalation, centralize collaboration, build an incident timeline, and support post-incident reviews.
What features should I look for in an incident response platform?
Prioritize automated alerting and escalation, integrated communication (Slack or Microsoft Teams), role-based workflows, automatic timeline and documentation, post-incident analysis, and integrations with your observability, CI/CD, and ticketing tools.
What is the best incident response tool in 2026?
The best tool depends on your team’s size and workflows. Slack-native platforms like Rootly suit engineering teams that want automation and low context-switching; PagerDuty and Jira Service Management fit large or Atlassian-centric enterprises; incident.io is a common modern alternative. Teams on Opsgenie should plan ahead for its April 2027 end of life.
How do I measure whether an incident response tool is working?
Track MTTA (mean time to acknowledge), MTTR (mean time to resolve), incident recurrence rate, postmortem completion rate, and automation adoption. Improvements across these metrics show the tool is reducing downtime and strengthening reliability.
To see how this future looks in action, book a demo and explore how Rootly can transform the way your team responds to incidents.