

Alert management metrics measure the quality, speed, operational impact, and human cost of the alerts generated by an engineering organization. They show whether changes to noise reduction, deduplication and correlation, and routing are actually improving the response.
An alerting system is effective only when it detects meaningful risk, reaches the correct responder, and leads to timely action. A growing alert count does not necessarily indicate stronger monitoring. It may instead reveal duplicate notifications, weak thresholds, unclear service ownership, or monitors that detect technical activity without identifying genuine user impact. The right on-call management software helps teams coordinate routing, escalations, and response workflows while collecting the data needed to evaluate alert performance.
Engineering teams therefore need to measure more than mean time to acknowledge and mean time to resolve. A mature alert-management program also evaluates alert actionability, routing accuracy, escalation behavior, noise reduction, detection coverage, repeated failures, and on-call sustainability.
Key Takeaways
- Alert volume, mean time to acknowledge, false positive rate, and actionable alert rate provide the foundation of an alert-management scorecard.
- Alert quality should be measured alongside response speed because fast acknowledgment does not make an irrelevant alert useful.
- Median and percentile response times provide more insight than averages alone.
- Alert-management data should be segmented by service, severity, source, team, and time of day.
- Metrics should guide alert tuning and reliability investments, not rank individual responders.
What are alert management metrics?
Alert management metrics are quantitative measurements that show whether alerts are relevant, actionable, correctly routed, and handled without creating unsustainable operational load.
These measurements cover the period from the moment a monitoring condition is detected through notification, acknowledgment, escalation, mitigation, resolution, and follow-up.
Alert management metrics overlap with incident response metrics, but they are not identical.
An alert is a notification that a predefined condition has occurred. An incident is a service disruption or operational event that requires coordinated action. One incident may generate dozens or hundreds of alerts, while many low-value alerts may never become incidents.
That distinction matters. Mean time to resolve may reveal how efficiently teams restore service, but it does not show whether the alerting system generated 200 duplicate notifications before the incident was declared.
Google’s Site Reliability Engineering (SRE) guidance recommends that paging alerts reflect symptoms that threaten service objectives and require a meaningful human action. Alerts that cannot be acted upon create noise and weaken responder attention.
Metrics Versus KPIs
A metric is any measurable value, such as the number of alerts generated in a week.
A key performance indicator, or KPI, is a metric tied to a defined operational objective. Alert volume becomes a KPI when a team establishes an expected range, assigns an owner, and uses deviations to trigger investigation or improvement work.
Useful alert-management KPIs have five characteristics:
- A consistent definition
- A clear owner
- A measurable target or baseline
- A direct relationship to reliability or responder health
- A defined action when performance changes
A five-layer alert management KPI framework
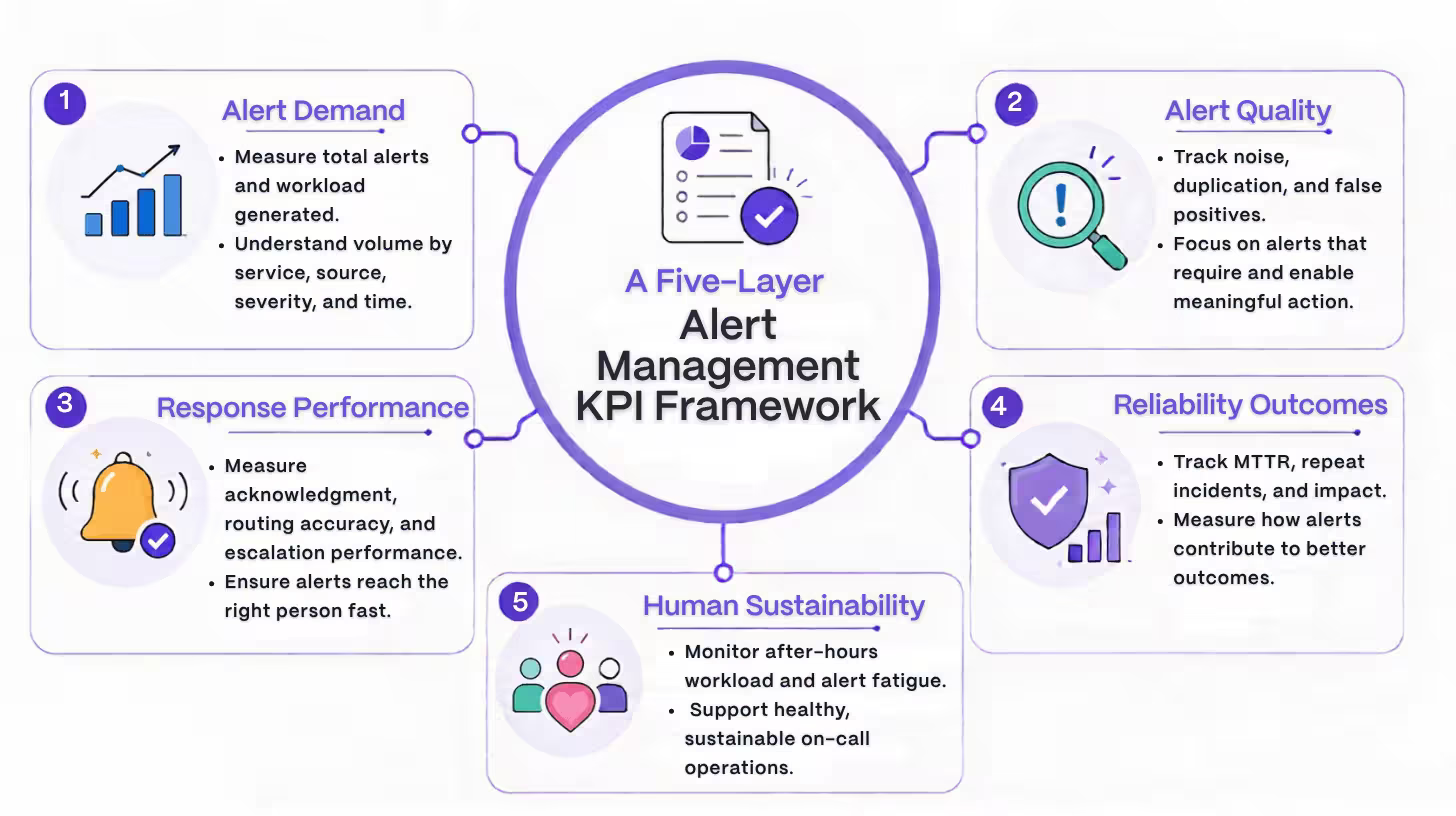
A complete alert-management scorecard should measure five areas: alert demand, alert quality, response performance, reliability outcomes, and on-call sustainability.
These layers should be evaluated together. Reducing alert volume, for example, may lower noise but also hide legitimate failures. Similarly, faster acknowledgment times may look positive while creating unnecessary interruptions for responders.
- Alert Demand: How much work does the alerting system create?
- Alert Quality: How much of that work is relevant, unique, and actionable?
- Response Performance: How quickly and accurately do alerts reach the correct responders?
- Reliability Outcomes: Do alerts help limit customer impact and restore service?
- Human Sustainability: Can the on-call rotation absorb the workload without chronic interruption or burnout?
Core alert volume and workload metrics
1. Total Alert Volume
Total alert volume is the number of alerts generated during a defined period.
Track it by hour, day, week, and on-call rotation. The metric establishes the baseline required to interpret most other alert-management KPIs.
Rootly’s on-call analytics documentation identifies total alerts as a baseline for detecting spikes caused by deployments, outages, or noisy monitors.
Alert volume becomes more useful when segmented by:
- Service
- Monitoring source
- Severity
- Environment
- Team
- Alert rule
- Deployment window
- Business hours versus after-hours
A sudden increase may indicate instability, but it can also result from a new integration, duplicated alert rules, or threshold changes. Volume should therefore be investigated rather than interpreted in isolation.
Formula:
Alert volume = Count of alerts generated during the measurement period
2. Alerts per Service
Alerts per service show which systems create the greatest operational demand.
This metric prevents a high-volume service from being hidden inside an organization-wide average. Normalize the result where necessary by traffic, request count, deployment frequency, or service criticality.
A service receiving 500 alerts may not be less reliable than a service receiving 50 if it processes 100 times more traffic. The normalized rate provides the stronger comparison.
3. Alerts per On-Call Shift
Alerts per shift measure the interruption load carried by each rotation.
This is more useful for workforce planning than organization-wide alert volume because it reflects the experience of the person currently responsible for responding.
Track:
- Total pages per shift
- Actionable pages per shift
- After-hours pages per shift
- Maximum alerts in any one-hour period
- Number of uninterrupted shifts
Do not use this metric to score individual engineers. Its purpose is to identify unsustainable rotations, noisy services, and uneven staffing.
4. After-Hours Alert Percentage
After-hours alert percentage is the share of alerts delivered outside the receiving team’s normal working hours.
After-hours alert percentage = After-hours alerts ÷ Total alerts × 100
A high percentage may be justified for a globally critical service. It may also expose weak regional coverage, insufficient automation, or low-priority rules incorrectly configured as pages.
5. Alert Concentration
Alert concentration measures how much total alert volume is produced by a small number of rules, services, or sources.
A useful version is the percentage of alerts generated by the ten highest-volume rules.
Top-rule concentration = Alerts from highest-volume rules ÷ Total alerts × 100
A high concentration is not automatically bad. It is an opportunity to focus tuning work where it will create the largest reduction in operational noise.
Alert quality and noise metrics
6. Actionable Alert Rate
Actionable alert rate is the percentage of alerts that require a responder to investigate, mitigate, escalate, or make a meaningful decision.
Actionable alert rate = Actionable alerts ÷ Total alerts × 100
An acknowledgment alone should not classify an alert as actionable. Teams need a standardized disposition taxonomy, such as:
- Action taken
- Incident created
- Escalated
- Duplicate
- Informational
- Self-resolved
- False positive
- No action required
Actionable alert rate is one of the strongest overall indicators of alert quality because it connects notifications to human decisions.
7. False Positive Rate
False positive rate is the percentage of alerts that indicate a problem when no meaningful problem or required response exists.
False positive rate = False positive alerts ÷ Total evaluated alerts × 100
False positives commonly result from unstable thresholds, short-lived metric spikes, expected deployment behavior, incomplete dependencies, or rules that detect causes rather than user-facing symptoms.
A declining false positive rate usually indicates stronger alert precision. However, teams should not reduce noise by blindly increasing thresholds. Excessive suppression can create false negatives, in which a meaningful failure occurs without an alert.
Google’s guidance on service-level objective alerting treats precision and recall as complementary properties. Precision measures the proportion of generated alerts that represent significant events, while recall measures the proportion of significant events that were successfully detected.
8. Alert-to-Incident Ratio
Alert-to-incident ratio measures how many alerts are generated for each declared incident.
Alert-to-incident ratio = Total alerts associated with incidents ÷ Total incidents
A very high ratio often indicates duplicate rules, poor correlation, or an alert storm. A very low ratio may be healthy, but it may also indicate incomplete monitoring.
The ratio should be evaluated by incident type and severity. A distributed infrastructure failure will naturally generate more related signals than a narrow application defect.
9. Duplicate Alert Rate
Duplicate alert rate is the percentage of alerts that repeat an already-known condition without adding useful context or requiring a separate action.
Duplicate alert rate = Duplicate alerts ÷ Total alerts × 100
Duplicates may originate from multiple monitoring tools, repeated notifications from the same rule, or several symptoms generated by one underlying failure.
Reducing duplicates lowers cognitive load and helps responders identify the primary signal.
10. Alert Compression Rate
Alert compression rate measures the percentage of raw alerts consolidated into a smaller number of correlated alert groups or incidents.
Alert compression rate = (Raw alerts - Consolidated alert groups) ÷ Raw alerts × 100
For example, if 100 raw alerts are consolidated into 10 meaningful groups, the compression rate is 90%.
A higher compression rate may indicate effective deduplication and correlation, but it is not automatically evidence of better alerting. Teams should verify that grouped alerts share a meaningful operational relationship and that important context remains visible.
Research into large-scale cloud systems describes alert aggregation as essential during alert storms because many correlated notifications can originate from a small number of root causes.
11. Suppression Rate
Suppression rate is the percentage of potential alerts prevented from reaching responders by deduplication, maintenance windows, dependency logic, or other filtering rules.
Suppression rate = Suppressed alerts ÷ Total potential alerts × 100
Track suppression by reason. Planned-maintenance suppression should not be analyzed in the same category as machine-learning-based noise filtering or dependency suppression.
Pair this KPI with missed-incident reviews. A rising suppression rate is beneficial only when detection coverage remains stable.
Response speed and routing metrics
12. Mean Time to Acknowledge
Mean time to acknowledge is the average elapsed time between an alert firing and a responder acknowledging it.
MTTA = Total acknowledgment time ÷ Number of acknowledged alerts
Mean time to acknowledge, or MTTA, reflects notification reachability, escalation effectiveness, responder availability, and the perceived credibility of the alert.
A rising MTTA may indicate:
- Alert fatigue
- Incorrect routing
- Weak escalation policies
- Missing schedule coverage
- Notification delivery failures
- Too many low-priority pages
- Unclear ownership
Measure MTTA by severity and time of day. A single average can hide severe outliers.
Use Medians and Percentiles With MTTA
Averages are vulnerable to unusually long acknowledgment times. Teams should also report:
- Median MTTA
- 90th-percentile MTTA
- 95th-percentile MTTA
- Maximum MTTA for critical alerts
The median describes the typical alert. Higher percentiles reveal the slow-response tail that often creates the greatest reliability risk.
13. Escalation Rate
Escalation rate is the percentage of alerts that move beyond the initially assigned responder or escalation step.
Escalation rate = Escalated alerts ÷ Total alerts requiring acknowledgment × 100
A high escalation rate can indicate unavailable responders, inaccurate schedules, unclear ownership, or alerts sent to teams without the knowledge required to act.
A low rate is not always desirable. An escalation policy that fails to advance unacknowledged alerts may produce a low rate while leaving incidents unmanaged.
Pair escalation rate with:
- Escalation depth
- Time between escalation steps
- Final acknowledging team
- Number of failed notification attempts
14. Routing Accuracy
Routing accuracy is the percentage of alerts initially delivered to the team capable of taking ownership without reassignment.
Routing accuracy = Correctly routed alerts ÷ Total routed alerts × 100
Routing accuracy exposes a problem that MTTA may miss. An alert can be acknowledged quickly and still lose valuable time while teams determine who owns the affected service.
Measure routing accuracy using reassignment events, ownership changes, or alert dispositions.
15. Unacknowledged Alert Rate
Unacknowledged alert rate is the percentage of alerts that close, expire, or remain open without receiving human acknowledgment.
Unacknowledged alert rate = Unacknowledged alerts ÷ Total alerts × 100
A high rate may indicate low-value alerts, failed notification delivery, obsolete rules, missing coverage, or responders who no longer trust the alert stream.
Rootly’s documentation notes that low acknowledgment rates can indicate alert fatigue, routing problems, or misconfigured notifications.
Resolution and reliability metrics
16. Mean Time to Resolve (MTTR)
Mean time to resolve is the average time from an alert or incident trigger until the affected service has been restored or the alert condition has been fully resolved.
MTTR = Total resolution time ÷ Number of resolved events
Mean Time to Resolve (MTTR) can also mean mean time to repair, recovery, or restoration. Teams should select one definition and apply it consistently.
MTTR is a lagging outcome metric. It reflects more than alerting performance, including incident complexity, diagnostic quality, automation, runbook effectiveness, deployment speed, and coordination.
DevOps Research and Assessment (DORA) separately measures failed deployment recovery time as the time required to recover from a deployment failure that requires immediate intervention.
17. Repeat Alert Rate
Repeat alert rate is the percentage of resolved alerts that recur for the same underlying condition within a defined period.
Repeat alert rate = Recurring alerts ÷ Resolved alerts × 100
Repeated alerts often expose unresolved root causes, temporary mitigations, incomplete remediation work, or thresholds that remain poorly tuned.
Set recurrence windows according to the service and failure mode. A seven-day window may work for application errors, while capacity-related issues may require a longer interval.
18. SLO-Related Alert Coverage
Service-level objective alert coverage measures the percentage of material service-level objective threats or breaches detected by an appropriate alert.
A service-level objective, or SLO, defines a reliability target for a user-facing service indicator.
SLO alert coverage = SLO threats detected by alerts ÷ Total validated SLO threats × 100
SLO-related alerts connect operational response to customer experience. Google’s SRE guidance describes service-level indicators as the first metrics teams should inspect when SLO-based alerts trigger.
Coverage should be paired with precision. Detecting every SLO threat is not useful if responders are paged constantly for events that are unlikely to consume meaningful error budget.
On-call health metrics
On-call health metrics measure whether alert workload can be sustained without excessive interruption, uneven burden, or chronic fatigue.
A technically functional alerting system can still fail its engineering organization if it repeatedly wakes responders for low-value events.
Important on-call health measures include:
- Pages per shift
- After-hours pages
- Nighttime interruption frequency
- Consecutive interrupted shifts
- Alert load by team
- Schedule overrides
- Manual actions per alert
- Time spent on alert-related work
- On-call satisfaction
- Percentage of shifts with no pages
Track these at the team and rotation level. Individual-level data may help investigate workload distribution, but it should not become a productivity ranking.
A responder who handles fewer alerts may own a stable service, while another may carry a noisy legacy system. The difference does not measure individual effort or ability.
Alert management KPI formula table
| KPI | FORMULA | PRIMARY QUESTION |
|---|---|---|
| Alert volume | Count of alerts | How much demand is the system creating? |
| Actionable alert rate | Actionable alerts ÷ total alerts × 100 | How many alerts require meaningful action? |
| False positive rate | False positives ÷ evaluated alerts × 100 | How much of the alert stream is incorrect or harmless? |
| Alert-to-incident ratio | Incident-linked alerts ÷ incidents | How many alerts accompany each incident? |
| Duplicate alert rate | Duplicate alerts ÷ total alerts × 100 | How much repeated noise exists? |
| Alert compression rate | (Raw alerts - groups) ÷ raw alerts × 100 | How effectively are related alerts consolidated? |
| MTTA | Total acknowledgment time ÷ acknowledged alerts | How quickly do responders acknowledge alerts? |
| Escalation rate | Escalated alerts ÷ eligible alerts × 100 | How often does the first notification path fail? |
| Routing accuracy | Correct initial assignments ÷ routed alerts × 100 | Do alerts reach the correct owner first? |
| MTTR | Total resolution time ÷ resolved events | How quickly is service restored? |
| Repeat alert rate | Recurring alerts ÷ resolved alerts × 100 | Are underlying problems actually being fixed? |
| SLO alert coverage | Detected SLO threats ÷ validated SLO threats × 100 | Does alerting detect meaningful reliability risk? |
How to segment alert management data
Alert metrics should be segmented wherever aggregation could hide differences in risk, workload, or performance.
At minimum, segment the data by:
Service
Service-level segmentation identifies noisy systems and allows alert performance to be compared with reliability objectives.
Severity
Critical pages should have different acknowledgment and escalation expectations from warnings or informational notifications.
Monitoring Source
Comparing sources reveals duplicated coverage, poorly tuned integrations, and tools that produce disproportionate noise.
Team
Team-level views support ownership and capacity decisions without turning the dashboard into an individual leaderboard.
Time of Day
Business-hours averages frequently hide poor nighttime response or excessive after-hours pages.
Deployment Window
Alerts correlated with deployments can reveal risky release patterns, expected transient behavior, or missing change-aware suppression.
Customer Impact
Alerts associated with measurable user impact deserve more weight than internal conditions that never affect service delivery.
How to set alert management benchmarks
The right alert-management target is a service-specific threshold based on risk, historical performance, operational capacity, and customer impact.
Universal benchmarks should be treated cautiously. A payments platform, internal reporting tool, and development environment do not require the same paging behavior.
Use the following process:
- Establish a stable baseline.
- Remove obvious duplicates and invalid data.
- Segment by service and severity.
- Review median and percentile performance.
- Identify the operational outcome each metric should influence.
- Define an improvement target and guardrail.
- Reevaluate the target after major architectural or organizational changes.
Every optimization metric needs a balancing metric.
For example:
- Reduce alert volume while protecting detection coverage.
- Lower MTTA without increasing unnecessary pages.
- Increase compression without hiding distinct failures.
- Increase suppression while monitoring missed incidents.
- Reduce escalations without allowing alerts to remain unanswered.
Building an alert management dashboard
An alert-management dashboard should help leaders identify risk, help service owners improve alert quality, and help on-call teams understand current workload.
A single dashboard rarely serves every audience well. Use layered views.
Executive Reliability View
Include:
- Critical alert trend
- SLO-impacting incidents
- Customer-impact minutes
- MTTA and MTTR trends
- Repeat incident rate
- Major on-call risk indicators
Team Operations View
Include:
- Alerts per shift
- Actionable alert rate
- False positive rate
- Escalation rate
- After-hours alerts
- Highest-volume services
- Top recurring rules
Service Diagnostic View
Include:
- Alert volume by rule
- Duplicate rate
- Compression rate
- Routing accuracy
- Deployment correlation
- Alert-to-incident ratio
- Repeat alert rate
- SLO coverage
On-Call Health View
Include:
- Pages by shift
- Nighttime interruptions
- Alert distribution by rotation
- Schedule overrides
- Consecutive interrupted shifts
- Manual workload
- Unacknowledged alerts
Common alert measurement mistakes
Optimizing MTTA in Isolation
A team can lower MTTA by creating more aggressive notifications, but the additional interruptions may increase fatigue and reduce long-term responsiveness.
Treating Every Alert as Equal
A critical customer-facing outage and a low-priority capacity warning should not carry the same weight in averages or targets.
Reporting Only Averages
Means conceal outliers. Always pair averages with medians and higher percentiles.
Confusing Suppression With Quality
A large suppression rate can reflect excellent correlation or dangerous over-filtering. Missed-incident analysis is the required guardrail.
Ignoring Alerts That Never Fired
Alert data only reveals what the system detected. Post-incident reviews should identify failures that affected users without generating an appropriate notification.
Ranking Individual Responders
Alert metrics primarily measure systems, services, routing, and operational design. They are poor standalone measures of individual performance.
Measuring Tools Instead of Outcomes
The number of integrations, monitors, or automation rules does not prove that customers experience greater reliability.
Failing to Normalize Data
Traffic growth, deployment frequency, new services, and team expansion can change raw volume even when alert quality remains stable.
A practical alert review cadence
Alert reviews should convert operational data into owned tuning work, not merely produce another dashboard.
Daily
Check for:
- Critical unacknowledged alerts
- Sudden volume spikes
- Failed notification paths
- Active alert storms
- Repeated alerts from the same service
Weekly
Review:
- Highest-volume rules
- False positives
- Duplicate alerts
- Escalations
- After-hours pages
- Alerts with no documented action
Assign owners and deadlines for the most damaging sources of noise.
Monthly
Evaluate:
- Service-level trends
- Actionable alert rate
- MTTA percentiles
- Routing accuracy
- Repeat alert rate
- On-call load distribution
- SLO-related alert coverage
Quarterly
Reassess:
- KPI definitions
- Dashboard usefulness
- Escalation policy design
- Service ownership
- Staffing and rotation capacity
- Monitoring architecture
- Reliability investment priorities
Google’s outage-tracking guidance emphasizes starting from a known baseline and consistently annotating, grouping, and analyzing operational events to measure improvement over time.
How to improve alert management KPIs
Metrics create value only when they change operational behavior.
Remove Non-Actionable Pages
Move informational events to dashboards, tickets, or asynchronous channels. A page should indicate that a human decision or action is required.
Alert on User-Facing Symptoms
Prioritize latency, availability, correctness, and error-budget risk over fragile internal implementation details.
Correlate Related Signals
Group alerts by service, dependency, topology, timing, deployment, and likely root cause.
Improve Routing Context
Every page should include:
- Affected service
- Severity
- Current owner
- Customer impact
- Relevant dashboards
- Logs and traces
- Recent deployments
- Related alerts
- Runbook
- Recommended first action
Test Notification Paths
Regularly verify schedules, contact methods, escalation delays, and fallback responders.
Review Alerts After Incidents
Post-incident analysis should ask:
- Did the correct alert fire?
- Did it fire early enough?
- Did it reach the correct team?
- Was the message actionable?
- Which alerts were duplicates?
- Which signals were missing?
- Should the alert remain a page?
Fix Recurrence, Not Only Response
A falling MTTR is useful, but repeated incidents still consume engineering attention. Track remediation work until the underlying failure mode is removed or its risk is deliberately accepted.
A starter alert management scorecard
Teams that do not yet have reliable alert analytics should begin with a small, defensible scorecard:
- Total alert volume
- Alerts per on-call shift
- Actionable alert rate
- False positive rate
- Mean and median MTTA
- Escalation rate
- Repeat alert rate
- SLO-related alert coverage
This set covers demand, quality, speed, reliability, and human impact without creating an unmanageable reporting program.
Add more metrics only when the team has a clear decision or workflow connected to them.
Turn alert data into better reliability decisions
Alert-management metrics should explain whether the organization is detecting the right failures, notifying the right people, and producing an operational workload that teams can sustain.
The strongest programs do not pursue the lowest possible alert count or the fastest possible acknowledgment time in isolation. They balance precision, coverage, customer impact, responder workload, and long-term reliability.
Rootly gives engineering teams a unified way to manage alerts, on-call workflows, escalations, and incident response while tracking metrics such as total alerts, mean time to acknowledge, mean time to resolve, acknowledgment rate, and recurring operational patterns. Use Rootly to identify noisy services, strengthen response workflows, and turn alert data into measurable reliability improvements.
Frequently asked questions
What are the most important alert management metrics?
The most important alert management metrics are alert volume, actionable alert rate, false positive rate, mean time to acknowledge, escalation rate, alert-to-incident ratio, repeat alert rate, and SLO-related alert coverage. Together, they measure alert demand, quality, response performance, and reliability impact.
What is a good MTTA?
A good MTTA is one that meets the response requirement for the alert’s severity and customer risk. Critical alerts may require acknowledgment within minutes, while lower-priority notifications may not require immediate acknowledgment. Teams should establish service-specific targets and track median and percentile performance.
How is false positive rate calculated?
False positive rate is calculated by dividing the number of alerts classified as false positives by the total number of evaluated alerts and multiplying the result by 100. Teams need a consistent disposition process to calculate it accurately.
What is alert compression rate?
Alert compression rate is the percentage of raw alerts consolidated into a smaller number of correlated alert groups or incidents. It measures the effectiveness of deduplication and aggregation, but it should be reviewed alongside detection coverage.
How can engineering teams measure alert fatigue?
Teams can measure alert fatigue using alerts per shift, nighttime interruptions, unacknowledged alert rate, escalation rate, after-hours pages, schedule overrides, alert load distribution, and responder satisfaction. Rising acknowledgment times can also indicate declining trust in the alert stream.
How often should alerting KPIs be reviewed?
Operational exceptions should be reviewed daily, noisy rules weekly, service-level trends monthly, and KPI definitions or strategic reliability targets quarterly. Critical alert failures should be reviewed immediately after the associated incident.
Alert management metrics: 18 KPIs every engineering team should track